
Research
Data Search
The first step in this project was to find an API or large data set. I found a large data set from the World Wildlife Fund’s Living Planet Report (2022).

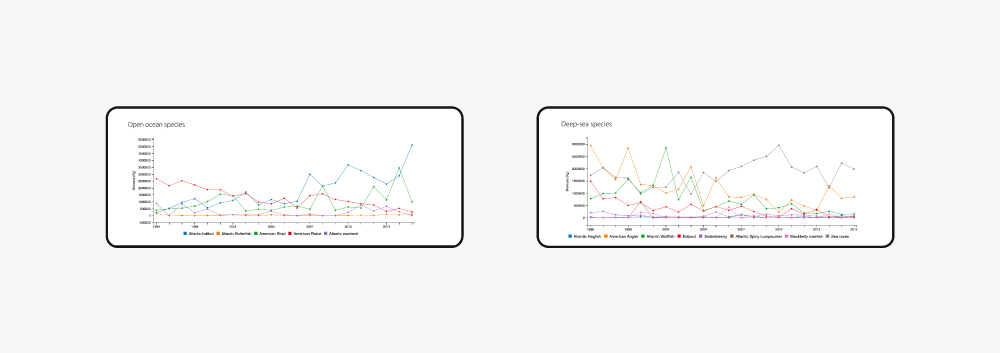
The great thing about WWF is they keep extensive records on animal populations in the world. However, this meant that I had to navigate through 10s of thousands rows of information. This took up a majority of the project time. I decided to narrow the focus of the article on fish populations in the Atlantic from 1990-2020. This reduced the data from tens of thousands of rows to about 200. From there, it was pretty easy to gather insights and trends from the data.
development
Data Visualization
Since the data showed changes in Atlantic fish species over time, I chose to use a line chart. C3.js made it super easy to input the data and integrate the chart into my code.
The great thing about WWF is they keep extensive records on animal populations in the world. However, this meant that I had to navigate through 10s of thousands rows of information. This took up a majority of the project time. I decided to narrow the focus of the article on fish populations in the Atlantic from 1990-2020. This reduced the data from tens of thousands of rows to about 200. From there, it was pretty easy to gather insights and trends from the data.
Data Retrieval
The main portion of this assignment was to successfully retrieve information using JSON and JS calls. Compiling the data was the easy part, but when it came to retrieving the data and formatting it in a readable, user-friendly table, I admittedly struggled. This portion of the project required a lot of trial-and-error, office hours with my professor, and hours scrolling online forums for me to finally format the data in a table.
Final Touches
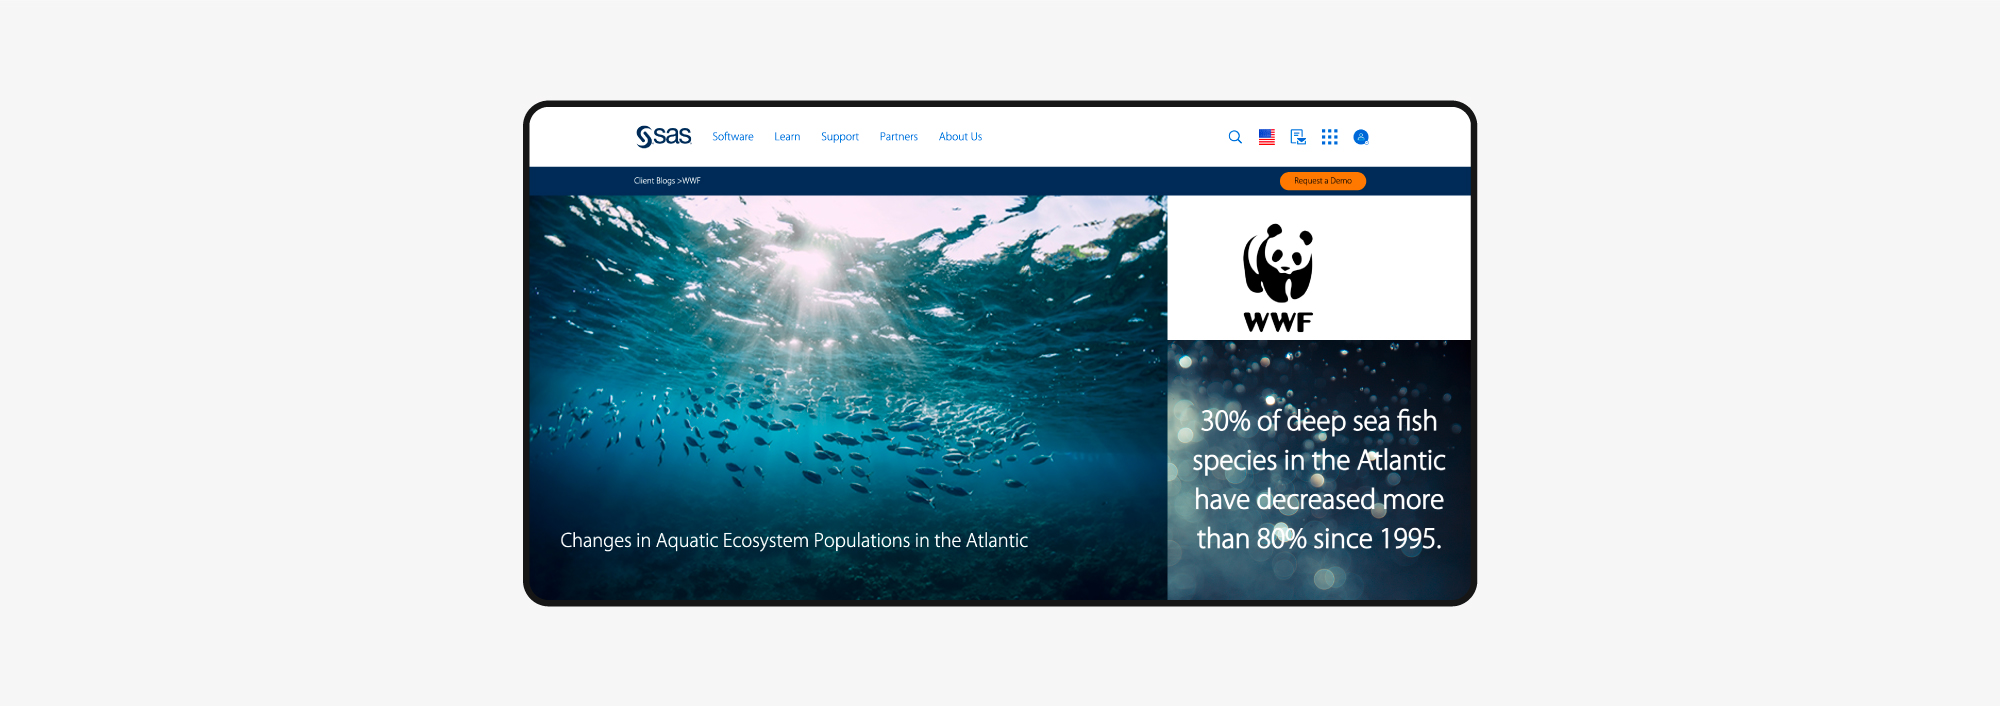
The final portion of this assignment was to create the page in the same style of a company we would like to work for. I chose to emulate the style of SAS, who partners with WWF. This part was the easiest portion of the assignment for me. Perfecting my work through final touches is one of my favorite parts of the design process.
End Product
The final product produced a webpage that looks like it could be on SAS’ website. It covers the changes in Atlantic fish populations over the last 30 years.
🏆 Achievements Unlocked!
- Organize and retrieve information using JSON and JS
- Skilled in sifting through data and narrowing scope